Description and useful information :
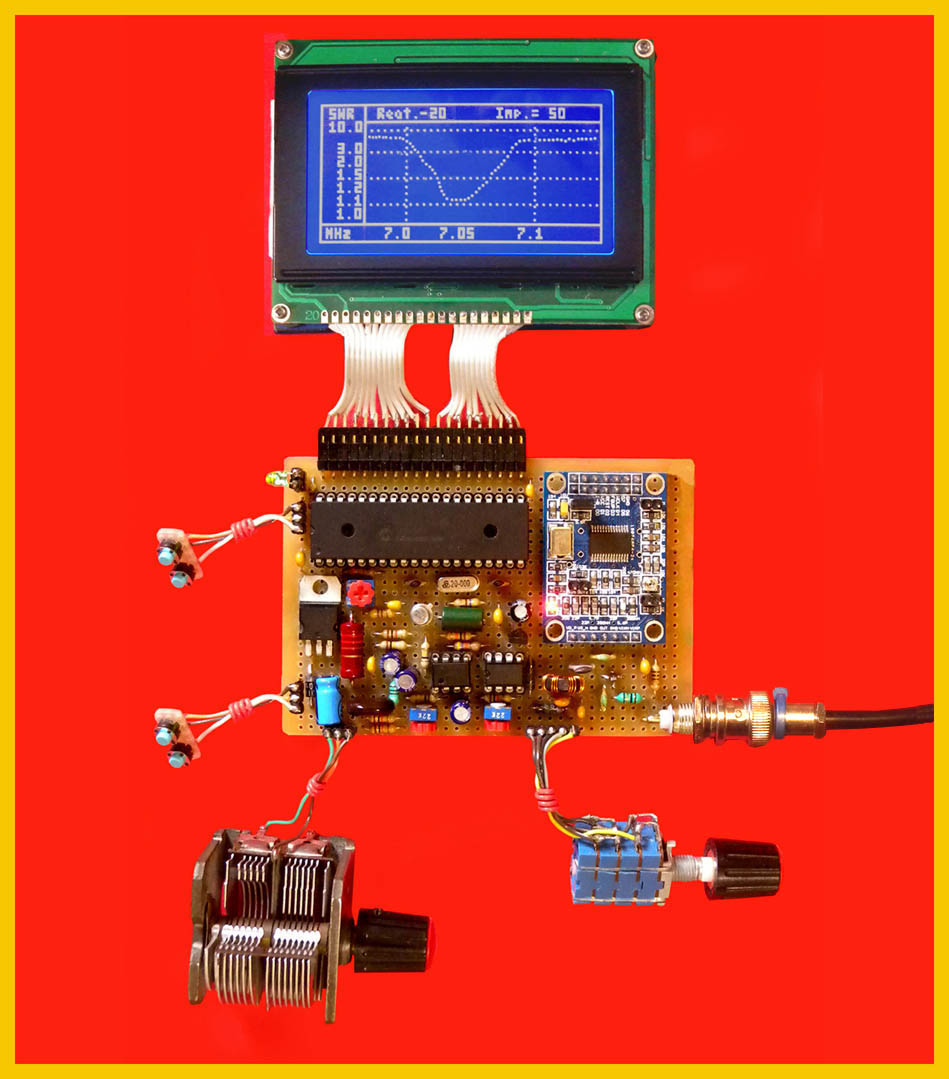
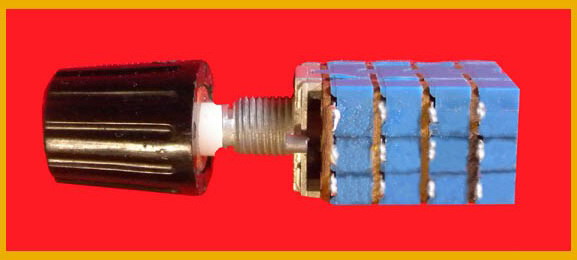
The project derives from the first version of the Antan antenna analyzer proposed by F6BQU. The response curve of the antenna under examination is displayed here, as well as the value of the reactance and impedance. Some indications: only the reset jumper (bottom left) must be inserted in the DDS module. Furthermore, for ease of drawing in the electrical diagram and in the block diagram, the module is drawn backwards (rotated 180°). As regards the measurement of the reactance, in practice the circuit is a frequency meter and it is necessary to adjust the value of the 525 pF capacitor so that the frequency measured on pin 7 of the LM311 remains in the range between 670 KHz with the variable capacitor closed while with variable open it must reach 730 KHz. In the photo at the bottom right you can see how to remedy this in the very probable case of the non-availability of the double 220 Ohm potentiometer: these are four potentiometers in parallel, two by two, with a value of 470 Ohm. If the red DDS LED does not always remain lit, the DDS is not connected so it is necessary to turn it off and on again to reset it. The function of the P 1, P 2, P 3, P 4 buttons is described below. As specified elsewhere on the site, these are experimental creations, therefore improvable and/or modifiable: no responsibility is assumed in this regard. Available for any requests for further clarification as well as providing the necessary software.
![]()
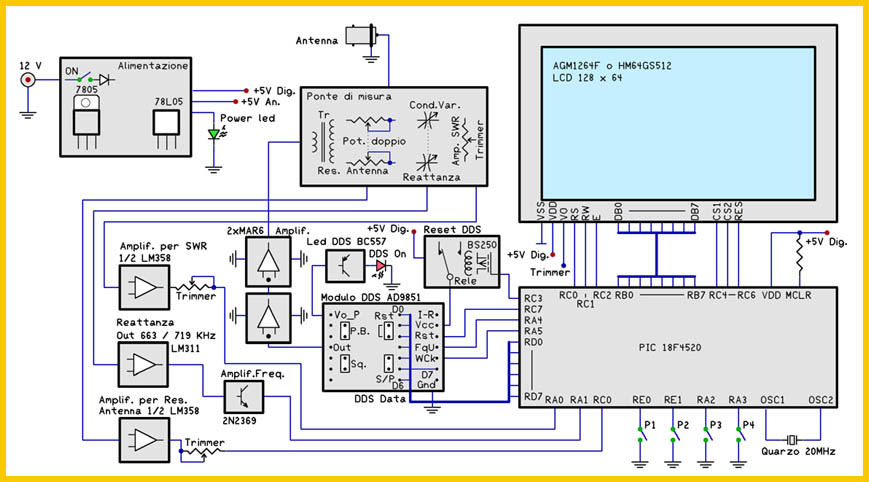
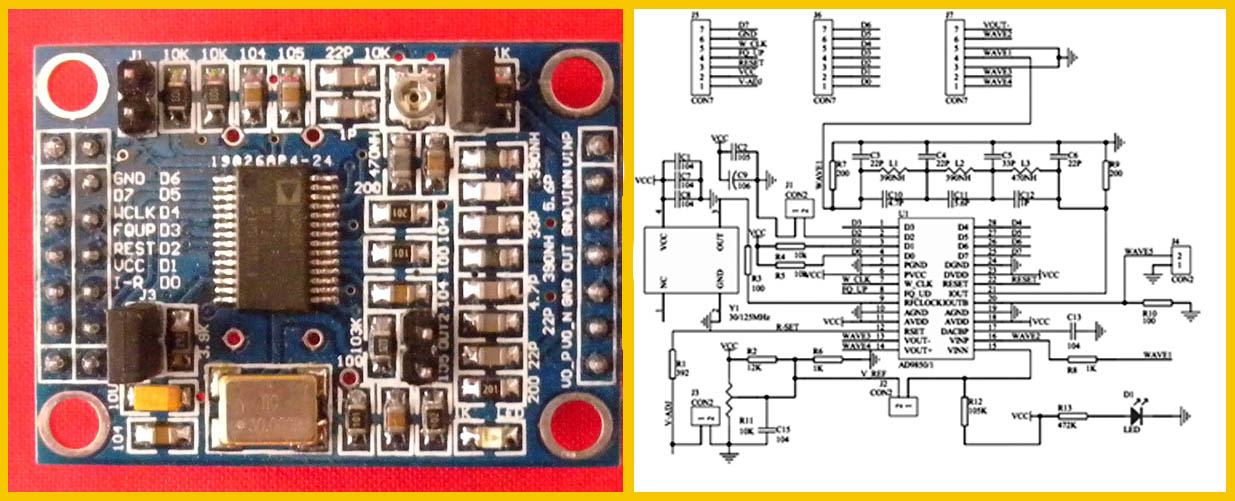
Block diagram
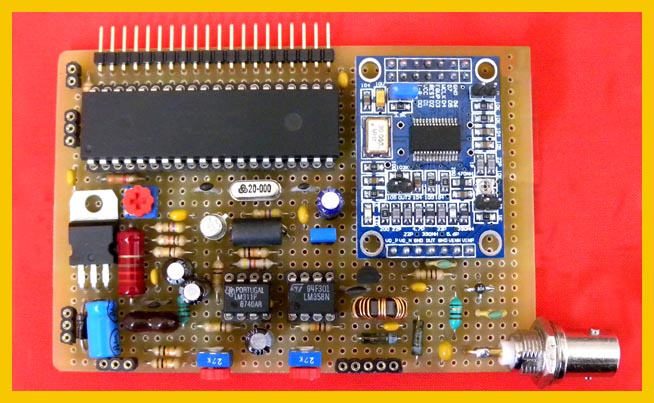
Main circuit PIC 18F4520
Modified potentiometer 4 x 470 Ohm
Covered bands :
160 meters 1.82 MHz -- 1.85 MHz
80 meters 3.5 MHz --- 3.8 MHz
40 meters 7.0 MHz --- 7.1 MHz
30 meters 10.1 MHz --- 10.15 MHz
20 meters 14.0 MHz --- 14.30 MHz
17 meters 18.0 MHz --- 18.16 MHz
15 meters 21.0 MHz --- 21.45 MHz
12 meters 24.89 MHz --- 24.99 MHz
10 meters 28.0 MHz --- 29.7 MHz
............................................................................................................................................
Frequency excursion DDS :
160 meters 1.80 MHz -- 1.87 MHz
80 meters 3.4 MHz --- 3.9 MHz
40 meters 6.95 MHz -- 7.15 MHz
30 meters 10.05 MHz - 10.2 MHz
20 meters 13.9 MHz -- 14.4 MHZ
17 meters 17.968 MHz 18.268 MHz
15 meters 20.8MHz --- 21.65 MHz
12 meters 24.84 MHz - 25.04 MHz
10 meters 27.15 MHz - 30.55 MH
............................................................................................................................................
Biographies
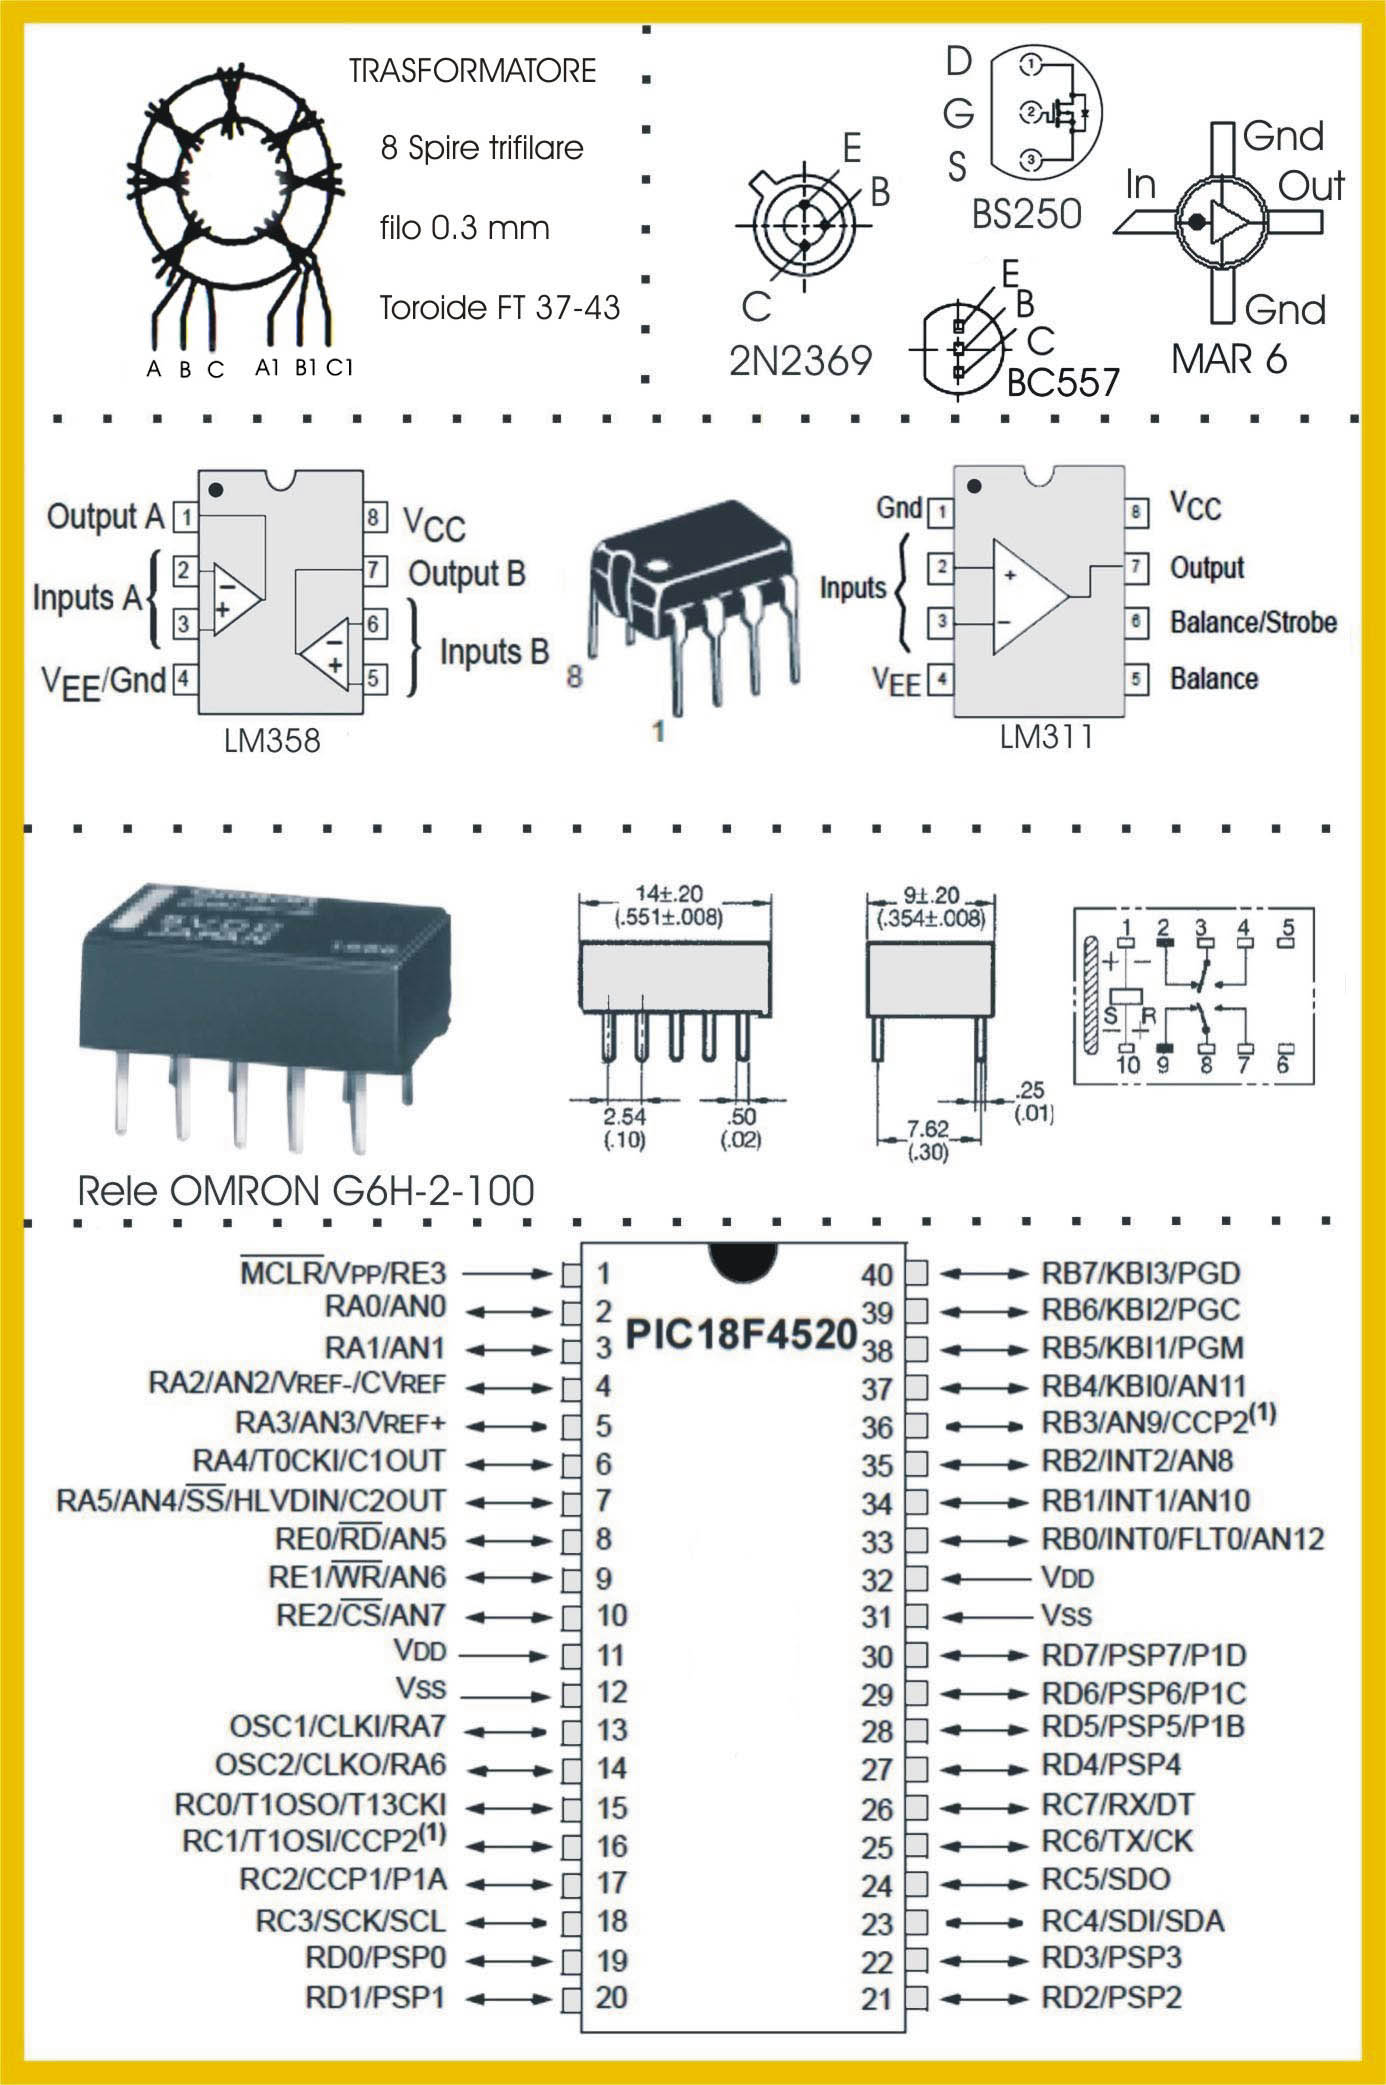
18F4520 Microchip datasheet DDS module
documentation AD 9851 Analog Device datasheet
CCS graphic display library.icrochip datasheet
DDS AD9851 module: view and wiring diagram
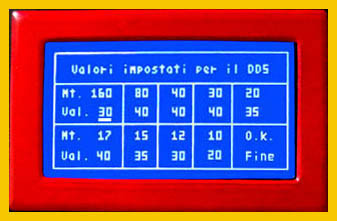
Above: View EEPROM Data Modification
Below: tool with entered EEPROM management buttons
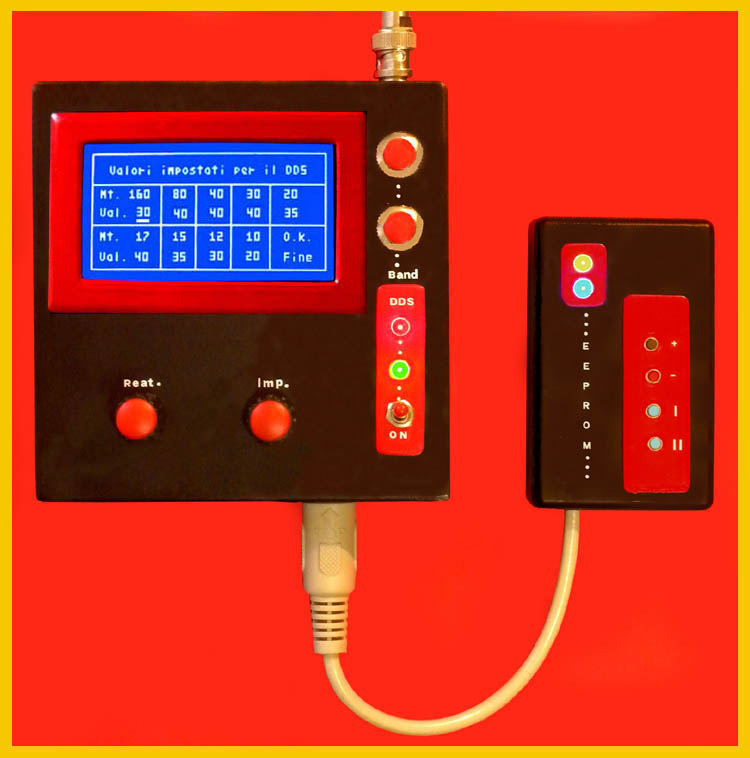
Description of buttons and EEPROM data for the DDS :
Normal mode:
P 1 : Move to the next band --- P2 : Switch to the previous band --- P 3 : no function --- P 4 : no function
EEPROM mode:
P 1: the set value increases --- P 2: the set value --- P 3: hold down to the ignition to enter EEPROM mode --- When.T. main program P 4: passes to the next value: if the cursor is on the end he returns at the beginning
Various indications :
The set value serves to move the track to the screen and therefore compensate for the different yield of the DDS on the various frequencies. It is a matter of obtaining the movement of the track over the entire extension of the screen. But first it is necessary to adjust the trimmer in an appropriate way. Then set the highest band (28 MHz) and adjust the SWR trimmer so that the track is positioned in the upper part of the screen: reactance at the max. value Impedance 50 ohm. Bring the reactance to 0 impedance always to 50 ohm and adjust the Amp.Swr trimmer to have the track at the bottom of the screen (1.0 SWR). In these adjustments no antenna or load inserted on the entrance. At this point we can possibly change the stored default values in the Eeprom and, as already mentioned, obtain the right excursion of the track in the various bands. Keep in mind that Values may vary from a minimum of 10 to a maximum of 80: in addition By increasing the set value brings the track down, while of course decrease the value shifts the track high. An important clarification, if The set value is too low, the track may appear at the bottom deceiving then the adjustment. To adjust the RES.ant trimmer. it is necessary to measure and adjust the Ponte side potentiometer on the 50 ohm then adjust the RES.ant trimmer. To read the same value on the screen: check that even at values of 75 - 100 ohm the corresponding values. As regards reactance, there would be no regulation if the frequency generated by the LM311 varies through the variable capacitor between a minimum of 670 kHz and a maximum of 730 kHz if this does not happen The value of the 525 PF capacitor and also insert a 180 pf compensator. In the photo you can see the band correction values set on a prototype. You can also see how the P1, P2, P3, P3 buttons are inserted in a separate container in such a way that, having done the calibration, they can be disconnected, and maintain only P1 and P2 necessary to commute the various .